AI-assisted threat hunting with Wazuh and Claude Code
Contents
The idea
After using Claude Code for code changes and an AWS account scan, I wanted to see if it could run a threat hunt.
Wazuh is an open-source security platform that collects and analyses endpoint activity. I used it as the data source and Claude Code as the investigator.
Prerequisites
- A Wazuh deployment (server + indexer + dashboard). The all-in-one quickstart is enough to start.
- Agents installed on the Linux and Windows hosts I want to monitor.
- Claude Code for the hunt.
Test setup
I set up Wazuh with the all-in-one installer, which places the indexer, server, and dashboard on one host:
curl -sO https://packages.wazuh.com/4.x/wazuh-install.sh
sudo bash ./wazuh-install.sh -a
I also enrolled several cloud and on-premises hosts to provide data for the hunt.
Wazuh collects only a limited set of logs by default. On Linux, I enable auditd, rootcheck, Security Configuration Assessment (SCA), and file integrity monitoring (FIM) for sensitive paths such as /etc, /root/.ssh, cron directories, and web roots. On Windows, I deploy Sysmon with a suitable configuration and collect the Security, System, PowerShell, and Defender channels. I cannot hunt data I do not collect.
Handing the agent access
The dashboard proxies searches to the indexer, so the agent does not need direct access to the indexer port. It needs an authenticated dashboard session. Instead of sharing a long-lived password or API key, I exported the short-lived session cookies from my browser after logging in. In a cookie-editor extension, open the dashboard tab and export the cookies as JSON. The search proxy uses security_authentication.
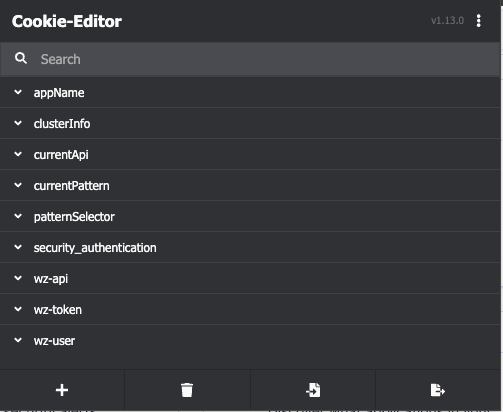
The Cookie-Editor extension showing the dashboard’s session cookies — security_authentication is the one the search proxy checks.
Because the cookie is tied to my login session, it expires automatically. It provides temporary access for the hunt without exposing a long-lived credential.
The hunt was two prompts
I wrote no search queries. The hunt used two prompts. The first provided access and requested a plan:
Here's a Wazuh dashboard (admin) at https://wazuh.example.com and the
short-lived session cookies exported from my cookie editor: <cookies>.
List the steps a threat hunter would take to make this platform useful.
I have 3 Linux and 1 Windows agent (1 macOS upcoming).
The agent produced a phased roadmap: verify data collection, expand telemetry, tune noise, and then begin active hunting.
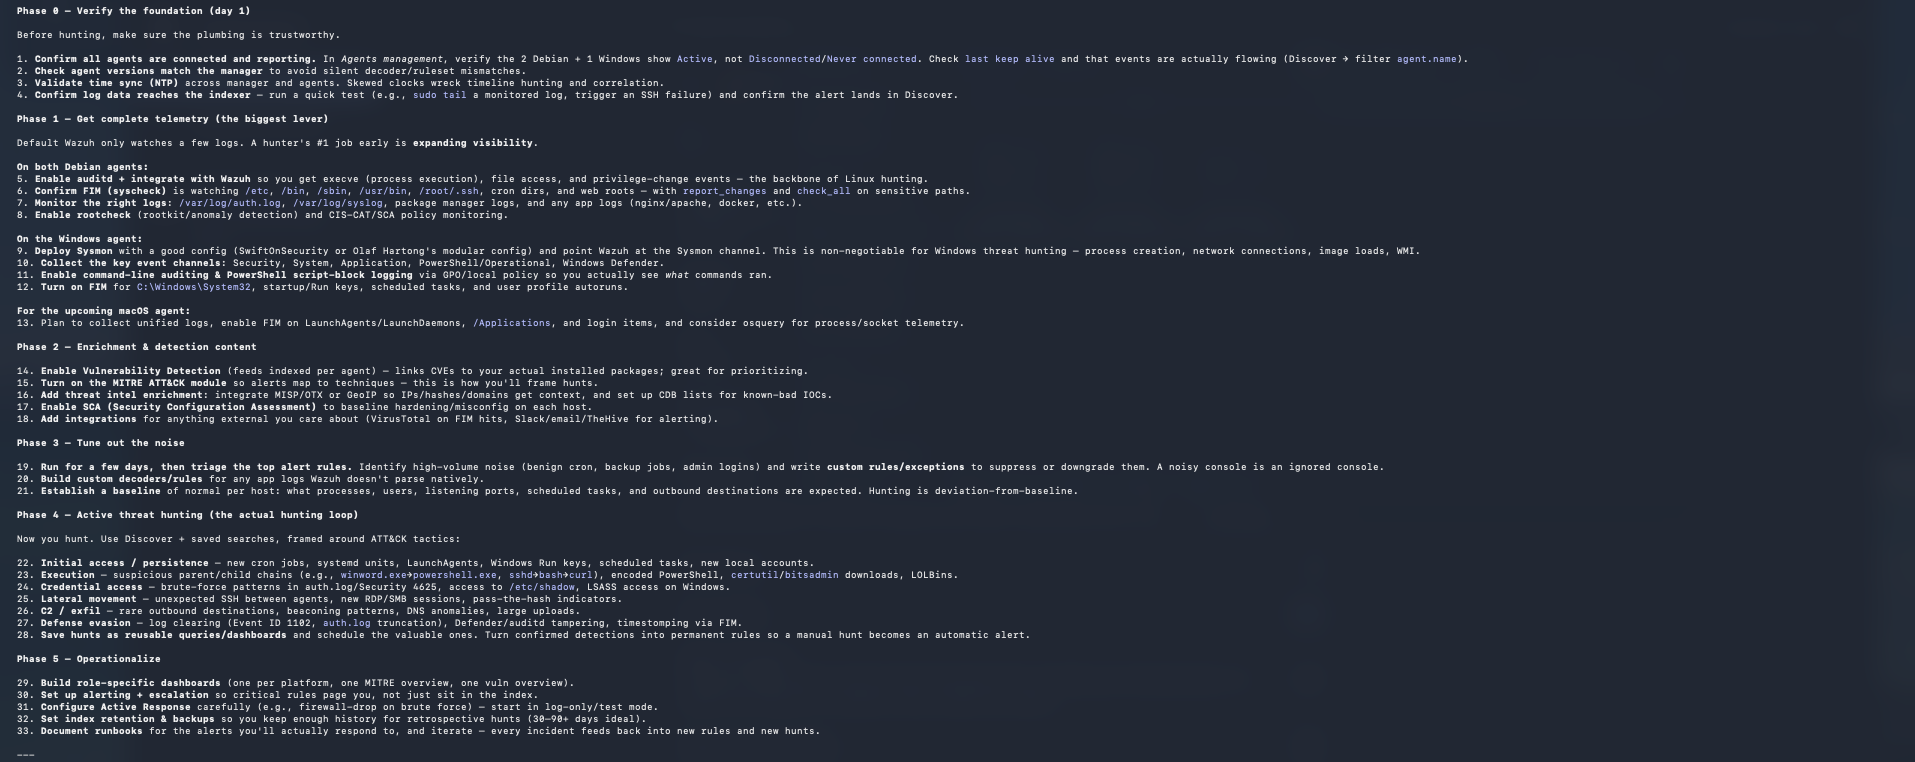
The agent’s phased roadmap — from verifying agents report, through expanding telemetry, to the active-hunting loop and operationalizing.
Then, to actually hunt:
Do the active-hunting phase for me.
The agent then found the dashboard’s search proxy, wrote a curl query helper, and ran aggregations against the live alert index. It examined failed and successful authentication by source IP, new accounts and services, stopped-agent events, and FIM changes across MITRE ATT&CK tactics. I supplied no query syntax.
What the agent found
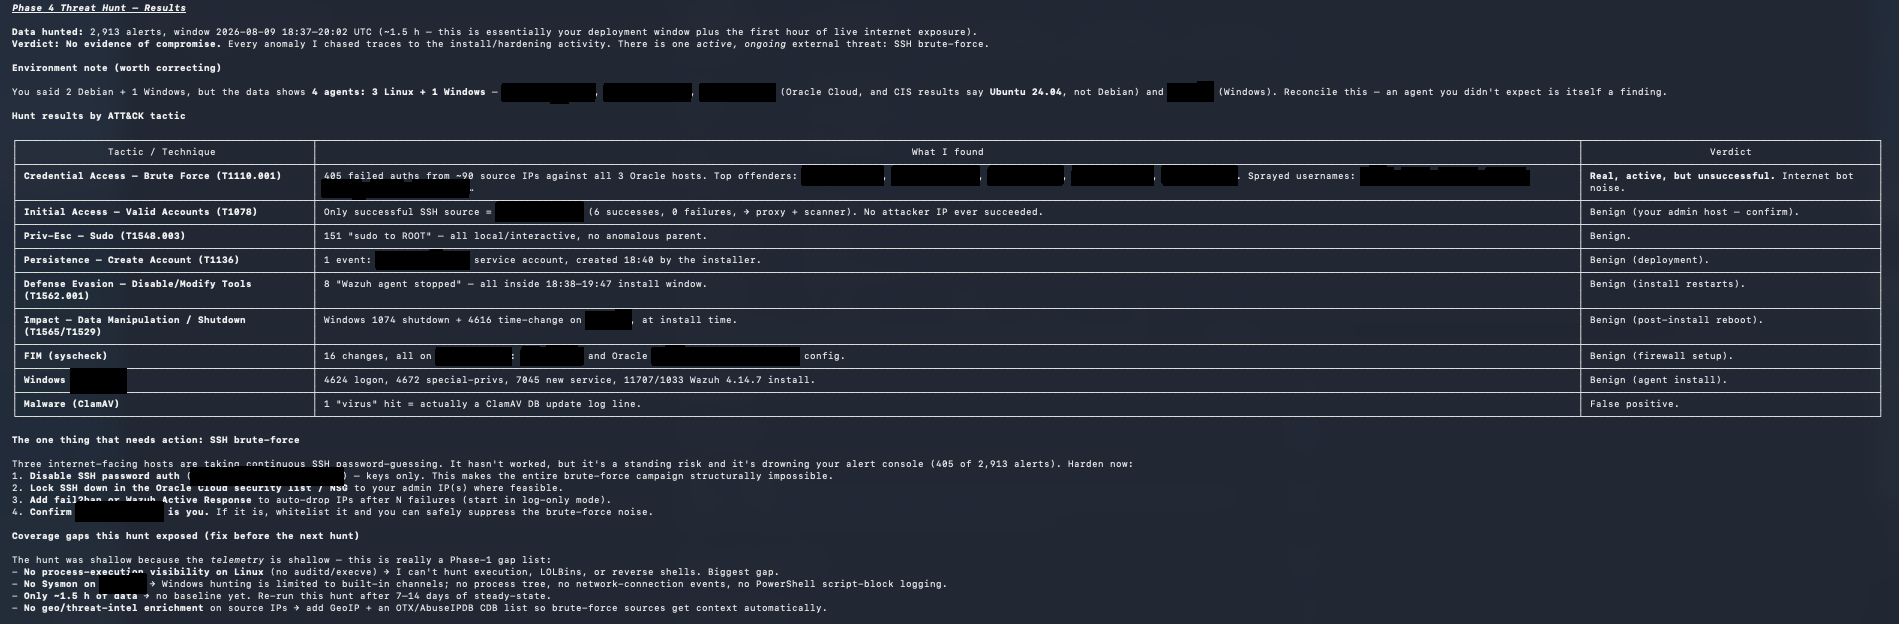
The agent’s Phase-4 results — a per-tactic table, a no-compromise verdict, and the one real action item (SSH brute-force). Hostnames and source IPs are blacked out.
Here is the report, with hostnames and IP addresses replaced by placeholders:
Data hunted: ~2,900 alerts, ~1.5 h window (deployment + first hour of exposure).
Verdict: No evidence of compromise. One active external threat: SSH brute-force.

Hunt results by ATT&CK tactic
- Credential Access — Brute Force (T1110.001): ~400 failed auths from ~90 source
  IPs against all 3 internet-facing hosts. Sprayed usernames: admin, test, remote,
  ubuntu, deploy...  → REAL, active, but unsuccessful (internet bot noise).
- Initial Access — Valid Accounts (T1078): only successful SSH source =
  198.51.100.10 (6 successes, 0 failures). No attacker IP ever succeeded. → benign
  (admin host — confirm).
- Persistence — Create Account (T1136): 1 event = service account created by the
  installer at deploy time. → benign.
- Defense Evasion — Agent stopped (T1562.001): all inside the install window. → benign.
- FIM (syscheck): all changes = firewall + monitoring-agent config at setup. → benign.
- Windows: logon + new service + agent install events. → benign.
- Malware (ClamAV): 1 "virus" hit = actually a DB-update log line. → false positive.

The one thing that needs action: disable SSH password auth (keys only), restrict SSH
by source IP, add fail2ban / Active Response. Confirm 198.51.100.10 is your admin host.

Coverage gaps: no auditd/execve on Linux and no Sysmon on Windows → cannot hunt
process execution yet. Only ~1.5 h of data → no baseline. Fix telemetry, then re-hunt.
The key step was comparing the brute-force source IPs with the successful-login source IPs. There was no overlap, so none of the sources behind the failed logins had gained access. Claude Code checked this faster than I would have done by hand, but I still had to decide whether the successful source IP belonged to me.
Gotchas
- My hunt is only as deep as my telemetry. Without
auditdon Linux and Sysmon on Windows, I cannot hunt process execution: no LOLBins, reverse shells, or command lines. I need to fix telemetry before judging the hunt. - I need a baseline. A new deployment has little data and no record of what is normal. I will run the hunt again after one or two weeks before trusting conclusions based on unusual activity.
- I treat the session cookie as a credential. Anyone with it can read my dashboard. I do not paste it into shared logs, and I log in again when the hunt is done to replace it.
- I still make the judgement calls. Claude Code cannot know whether an IP belongs to my admin host or an attacker unless I provide that context.
- Lock down SSH regardless. Internet-facing hosts get continuous brute-force. Disable password auth (keys only) and restrict by source; that removes the loudest source of alerts and the underlying risk at once.
What this series showed
This is the last stop in a four-part run where the AI did more and more of the work each time:
- Smarter prompts — get focused, predictable results out of Claude Code.
- Remote control with Cowork — I dispatched tasks from my phone.
- AWS security & billing scan — I scanned my AWS account and sorted the findings by urgency.
- Threat hunting with Wazuh (this post) — hand it a SIEM and let it pivot across MITRE ATT&CK tactics.
Across these four posts, I used Claude Code for code changes, an AWS scan, and a Wazuh threat hunt. It did the repetitive checks, but I still reviewed the results and made the decisions.